

 LinkedIn
Ask ChatGPT for the best email marketing tools for an online store five times in fresh chats. The shortlist can change. In one controlled test of 200 commercial queries run 50 times each, answers came back materially different 34% of the time, with brand citations shifting in 28% of responses. I used to tell clients a single screenshot proved they were winning in AI. I was wrong.
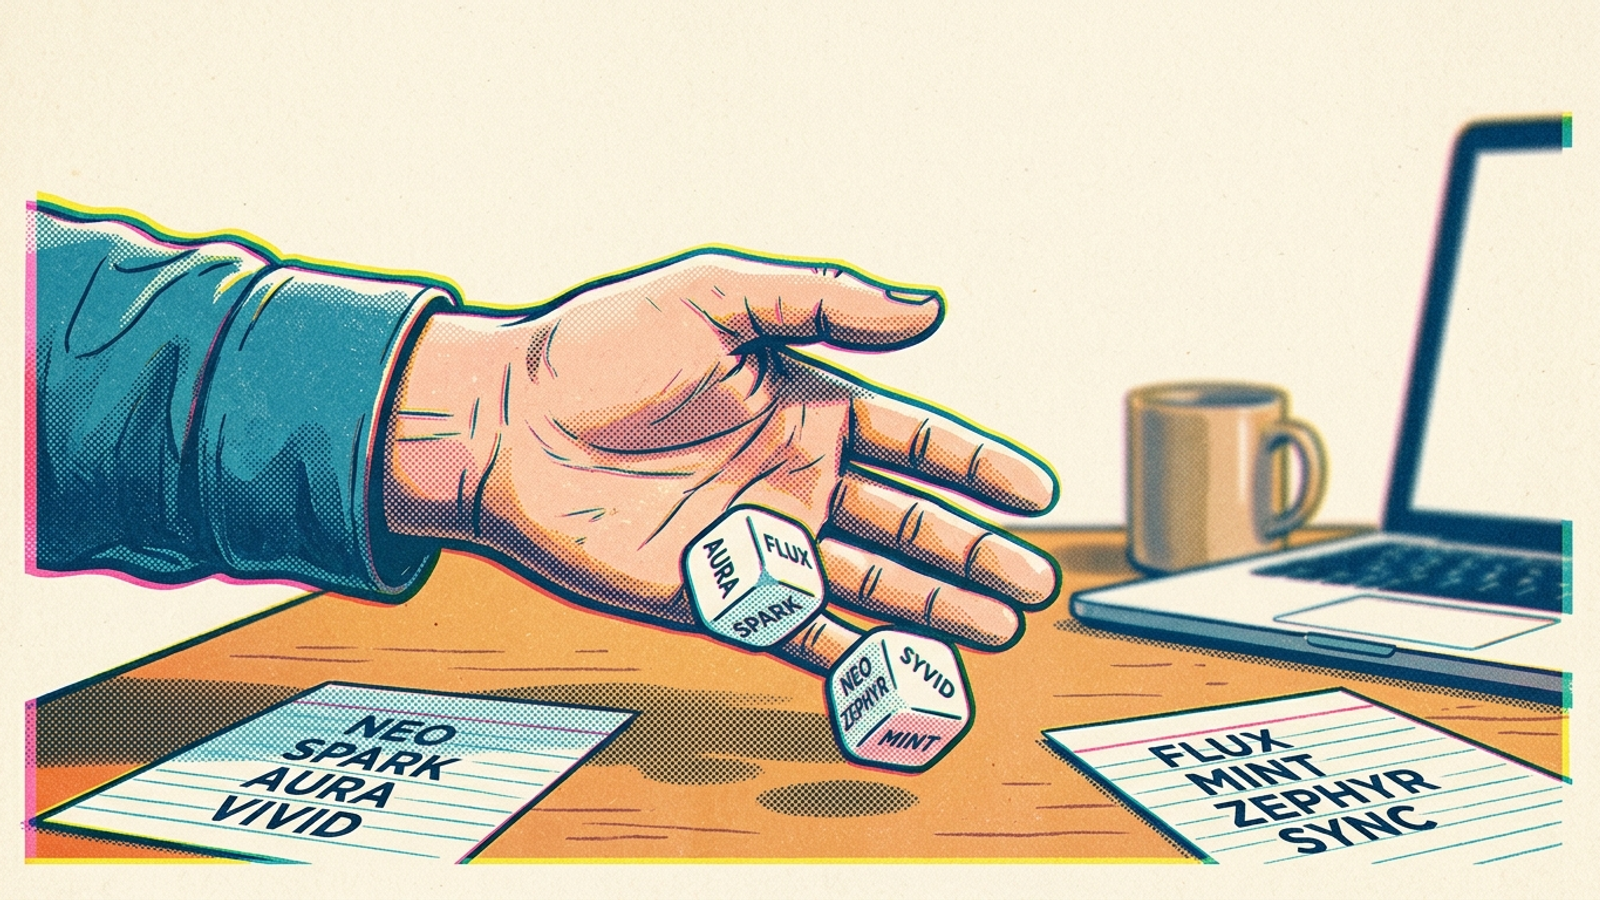
Everything here follows from one fact: AI answers are sampled, not looked up. The model chooses from possible next words, can draw on fresh web passages, and responds to the context it receives. That is why two users typing the identical question often read different replies. It is also why a visibility score built on one run per prompt tells you less than it appears to. Visibility is a rate out of N runs, with an error bar attached. Once you measure it that way, you can start separating a real gain from a lucky draw.
First, understand why the shortlist moves
The model does not fetch a stored ranking of brands. It predicts the next token, then the next, with each choice drawn from a probability distribution shaped by training, your prompt, and anything retrieved seconds ago. The setting that controls how flat or sharp that distribution is called temperature. Lower temperature stays close to the most likely choice. Higher temperature takes more flyers on less likely choices.
That dial can move the answer considerably. In the same 10,000-query test, temperature accounted for about 52% of answer variability. At ChatGPT’s default near 0.7, answers varied 34% of the time with about 72% citation consistency. Pin temperature to 0.0 and variability dropped to 8% with 94% consistency. Push it to 1.0 and variability hit 51%. Wider sampling spreads the brand lists; tighter sampling narrows them. A commercial measurement tool sits somewhere on that curve whether it tells you where or not.
The same question does not guarantee the same list. Before you call a brand’s appearance a win, you need to know how often it appears.
Separate what the model knows from what it fetches
It helps to picture two inputs: patterns stored in the trained model and pages fetched at answer time. That is not literally two brains stitched together. The picture breaks if it makes retrieval sound like a second model with its own opinions. Its useful point is narrower: changing what gets fetched can change the answer even when the prompt stays put.
Other context changes it, too. Prompt phrasing, memory, model routing and retrieval all contribute to shifting answers. A long chat changes the sample you are taking: fresh sessions varied about 31% of the time in testing, while sessions with 20 prior queries varied about 41% of the time. Same prompt, more context, wider spread. If you want to compare two weeks, do not collect one week in fresh chats and the next in a thread full of prior questions.
Keep AI Overviews out of the chatbot bucket
Google AI Overviews do not work like a chatbot with a search box. They load through a separate endpoint, run about 200ms of server-side passage retrieval, then about 1,200ms of LLM synthesis, and score those passages independently of classic blue-link rank. A page sitting at position 15 can get cited while position 1 gets skipped.
The difference shows up in brand reporting. ChatGPT names brands in 98.3% of ecommerce answers at about six brands per response, Perplexity names brands in 84.7% with about 8.49 citations, while Google AI Overviews names brands in only 7.2% of answers. Blend those into one visibility score and you hide which engine changed. Measure each engine on its own terms. Otherwise, the average cannot tell you what to fix.
Turn an appearance into a measurable rate
Vendors use visibility for several different counts. A mention means your brand appears anywhere in the answer; a citation is the stricter case where your domain appears as a named linked source. Share of voice divides your mentions by the combined mentions of you and named competitors on the same prompt set. Search Engine Land draws a useful business distinction: a citation signals trust, an unlinked mention signals awareness, referral clicks are downstream behavior, and coverage counts how many prompts you appear in at all. Confuse those and you can pay for awareness while thinking you bought trust.
Now take one prompt: best CRM for plumbers. Run it five times in fresh sessions. If your brand appears twice, your observed visibility on that prompt is 2 of 5, or 40%. It is not second place, and it does not mean you will appear in exactly four of the next ten answers. It means you saw two hits in five tries. Visibility is a rate out of N runs, not a rank. I log prompt name, engine, runs and hits. A screenshot of one of those five answers throws away the variation you were trying to measure.
A large multi-engine test makes the point harder to ignore. Across 2,961 prompts on ChatGPT, Claude and Google AI, researchers found each run produced a unique set of recommendations, with less than a 1% chance of identical brand lists across 100 runs. One check can show you what happened once. Five or ten checks let you begin counting how often it happens. Do not report a prompt as simply won or lost. Report it as 3 of 10 or 7 of 10, with the N attached.
Read the error bar before celebrating
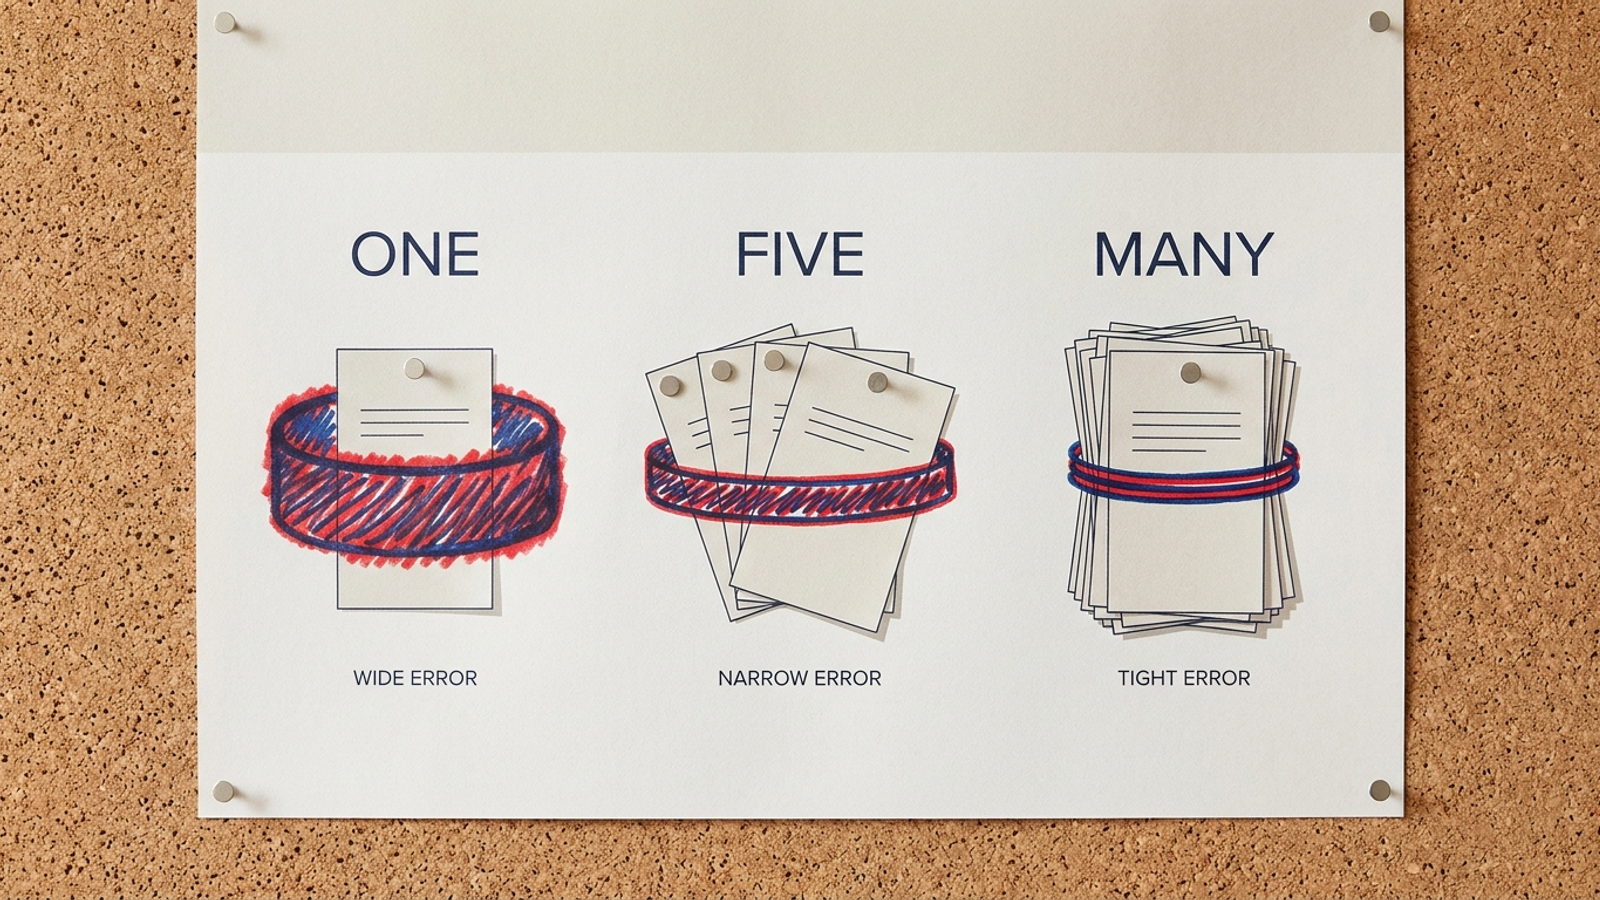
A rate without its sample size is a trap. Five runs can produce 40% visibility, but another five could look different without anything meaningful changing. With 30 runs, the worst-case margin of error is still about 18 points at 95% confidence; tightening that band to around 3 points takes thousands of runs. Each extra run helps narrow the uncertainty. A handful of runs leaves room for ordinary variation to swallow what looks like a month-to-month gain.
That is why I would question a report showing a jump from 20% to 30% until I saw the N. On one run each across 50 prompts, a few different answers could explain the move. On ten runs each across the same 50 prompts, you have 500 sampled answers and a better reason to investigate a sustained shift. You still need the same prompts and engines, counted the same way, before you credit a campaign or a page. More samples do not rescue a comparison that changed the question halfway through.
Never accept a visibility number without the run count printed next to it. Then check what, exactly, was held constant between the numbers being compared.
Choose buyer questions, not just keywords
The prompt is part of the measurement. Plumber CRM and best CRM for a 3-truck plumbing shop that integrates with QuickBooks and sends appointment reminders, under $100 per user do not ask for the same answer. The longer question supplies a buyer type, constraints, a software stack and a budget. Change a clause and you may change the brands named. That does not make either prompt wrong; it makes a prompt list worth examining before you trust its score.
Say you spend $20k a month on search and your best search terms convert on emergency and near me modifiers. Carry those same needs into AI questions, written the way a customer would say them rather than the way Keyword Planner displays them. Start with 15 to 20 buyer questions. Mix unbranded discovery, such as best email tools for Shopify stores doing 500 orders a month, with branded accuracy checks, such as what does [your brand] do.
Then keep a gap log: prompt, who got named, and which source got cited. If three rivals repeatedly appear when you do not, you have a specific comparison to investigate, not a vague instruction to “do more AI content.” I would look at the missing prompt and its cited sources before deciding which comparison page to write. Fifty good prompts beat five hundred padded ones. The point is to represent decisions your buyers actually make.
Build a repeatable test before buying a dashboard
The minimal setup fits on one sheet. Pick 10 to 20 real buyer questions, mixing branded and non-branded; ask each 2 to 5 times in fresh unpersonalized sessions across ChatGPT, Perplexity and Gemini; log mention, position, tone and sources per run; then repeat weekly or monthly on the same set. Use logged-out browsers or fresh chats, freeze the prompt text, and keep the conditions as consistent as you can between weeks. If you want a procedure for the logging, run this mention audit before you trust a vendor number.
The sheet needs the individual answers, not just a final percentage. Keep the prompt, engine, date, run count, brand hits and linked sources where you can inspect them. Then calculate the hit rate per prompt and print the N beside it. A change in citations may matter even when mentions hold steady; a change on one engine should not quietly become a claim about all of them. Same prompts, same engines, same counting rules, every time.
A spreadsheet carries that method to about 50 prompts and two engines before it gets unwieldy. Past that, the failure is operational. Context resets get skipped, someone rewords a prompt mid-month, citations get pasted without URLs, and nobody has time to rerun 200 answers by hand. How to measure AI visibility without tracking fake rankings shows the next step up from that sheet. I ran mine manually for a month and the numbers were honest. They were also late. Manual works until the reruns stop happening.
Make a vendor show you the denominator
Ask four questions before you believe a chart:
- How many runs did you make per prompt?
- Which engines did you test?
- Did you use fresh sessions or one logged-in thread?
- Did you count mentions and citations separately?
A report that cannot answer those questions may be a one-run methodology with better fonts. I look for the N beside every rate, a prompt list frozen across weeks, and engines reported apart. If ChatGPT, Perplexity and AI Overviews are blended into one score, the average hides the detail that tells you what to fix. For the longer argument on when tracking is worth paying for, read Is AI Prompt Tracking Worth Paying For. My rule still holds: pay for sampling discipline, not screenshots.
Say a report tells a plumbing-parts distributor it has 35% visibility. Without a method, that could mean appearances on 7 of 20 prompts checked once each. You cannot tell how often the brand would appear if you asked again. With a stated method, it could mean 35 hits in 100 sampled answers: 20 buyer prompts run five times each in fresh sessions, with linked citations split from bare mentions. Now you can inspect the underlying runs to find prompts that never name you, competitors that keep appearing, and citation gaps worth investigating. The percentage did not become magic. The denominator and the answer log made it usable.
That is the distinction behind what groas tracks weekly as Google and AI visibility: prompts, answers, citations and share of voice kept apart. A move from 20% to 30% is worth examining against those records, not celebrating because the line went up.
Try the model on a garage-door business
Say you run a garage-door company spending $20k a month. A vendor says your AI visibility rose from 18% to 31% after one blog post. Start at the first principle: answers are sampled. If the vendor ran each prompt once, a 13-point jump could sit inside ordinary variation. You have not yet learned whether more answers would name you more often.
Next, check the inputs. Were the buyer questions identical before and after? Were both sets run in fresh sessions? Did the vendor keep ChatGPT, Perplexity and AI Overviews separate, and count linked citations apart from bare mentions? Five runs per prompt would give you more to work with than one, but they would not prove the blog post caused the change. I would ask for the prompt list, the N, the engine split and the underlying hits before I changed a dollar of spend. If the vendor cannot show those, keep the spreadsheet and keep the money.
That is the method in one habit: count hits out of N, keep the N visible, and compare like with like. Pick 15 buyer questions, freeze their wording, run each several times fresh, log mentions and linked citations separately, then repeat weekly. If three prompts move from 2 of 10 to 7 of 10 and hold for a month while competitors fade, you have a pattern worth acting on. Without the repeated runs, it is a coin flip with a dashboard around it.